|
|||||||
|
||||||||
In common with one of the objectives of science, the description and modelling of surface form should be sufficiently precise, exhaustive, universal and orthogonal. Precision describes the degree to which a description is sensitive to variation. To describe a landscape verbally as 'rolling' is imprecise since it could be applied to a wide variety of landscapes with differing characteristics. A terrain description is exhaustive if it describes all aspects of the surface form. To describe a landscape as 'hilly' says nothing about the form of the surface not defined as hills. Universality relates to the appropriateness of a description in many contexts. To describe a part of a landscape as 'high' clearly depends on a local context with which to compare elevation. Finally, a useful set of terrain descriptors should be orthogonal in that as a set, there is no repetition or redundancy in description. This can be interpreted in a statistical sense (such as the use of factor analysis by Evans, 1984), a geometrical sense (such as profile and plan convexity described below, or the determination of eigenvalues (Gould, 1967)), or simply in a verbal sense (for example 'rough' and 'high' can be regarded as orthogonal descriptions).
The form of description investigated in this chapter is the parameterisation of a surface model. In this context, parameterisation has been defined as "the numerical description of continuous surface form" (Pike, 1993). More geomorphologically, it has been described as "a set of measurements that describe topographic form well enough to distinguish topographically disparate landscapes" (Pike, 1988). While both definitions hint at the aims of parameterisation, the measures described in this chapter are more closely associated with the statistical and geometrical definition of a parameter as "a line or quantity which serves to determine a point, line, figure, or quantity in a class of such things" (Chambers, 1990). Here, the identification of a unique and defining property of a surface model, is emphasised. Together surfaceparameters should be as few as possible, but convey maximum information and be as widely applicable as possible.
For effective geomorphological parameterisation, two additional criteria are required. Firstly, terrain parameters should be sensitive to geomorphological process as well as form. For example, altitude, slope and surface curvature (0, 1st and 2nd derivatives) are all affected by or influence geomorphological process. It is difficult to justify measuring the third derivative as it is not clear how this would be related to surface process. Secondly, a complete surface parameterisation must include reference to scale-based characteristics. The effects due to the scale of sampling and the way in which the surface model is stored should be separated from true surface scale-dependencies as far as possible. More specifically, this chapter will consider a method of surface parameterisation that is not constrained by the grid resolution of the DEM.
The di stinction by Evans (1972) of the measurement of surface form into specific and general geomorphology, provides a framework for classifying morphometric parameterisation. The dichotomy itself is perhaps unduly polarised as many forms of measurement fall somewhere between the two extremes. We can consider the form of measurement on a continuum (Figure 4.1). Progression along the continuum involves measuring a generally increasing amount of spatial information.
The position along the continuum determines the balance between the some of the aims of parameterisation described in section 4.1. Towards the 'general' end, parameterisation is relatively universal, but lacking in precision. Specific geomorphometry is precise, but can only be applied in a limited context. The characterisation methods described in this and the following chapter include examples of morphometric parameter, morphometric feature and geomorphometric feature identification.
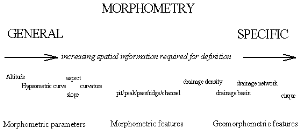 Figure 4.1 - A classification of morphometric characterisation.
Evans (1979) considers five terrain parameters that may be defined for any two dimensional continuous surface.
elevation
slope, aspect
profile convexity, plan convexity
These correspond to groups of 0, 1st and 2nd order differentials, where the 1st and 2nd order functions have components in the XY and orthogonal planes. Whilst higher derivatives may also be extracted, there is no evidence that these have any geomorphological meaning. Additionally, higher order derivatives must be based on surface patches modelled by higher order polynomials if any component is to be extracted. The higher the order of the polynomial, the greater the number of points required to uniquely identify the necessary coefficients. Since it is only the property of the surface at the central point of each local patch that is required, the effect of generalisation increases with the order of polynomial.
Evans goes on to approximate the surface using a bivariate quadratic function in the form:
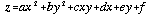 . . . . . . . . . . . (4.1)
This can be written in the form of the general conic:
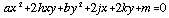 . . . . . . . . . . . (4.2)
Instances of the general conic fall into one of three types, depending on the values of the coefficients a,b and h (Stephenson, 1973, p.463) :
| ab - h2 > 0 | elliptic | ||
| if, | ab - h2 = 0 | conic is | parabolic |
| ab - h2 < 0 | hyperbolic | ||
These general forms correspond to the morphometric feature types, and can be used as part of the feature identification process (see Figure 4.2 and Chapter 5). Contour lines through each of these surfaces describe conic sections and can be seen from Figure 4.2 to be elliptic for pits and peaks, parabolic for channels and ridges, and hyperbolic for passes. For the purposes of general geomorphometry however, terrain parameters can be defined by considering the partial differential equations of the general quadratic form.
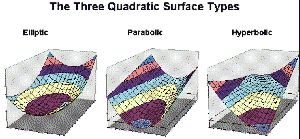 Figure 4.2 - A classification of quadratic surface types.
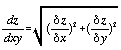
The rate of change of elevation in both the x and y directions can be used to identify the direction and magnitude of steepest gradient. These two parameters can be found by taking the partial first order derivatives of (1) above, with respect to x and y. Slope (magnitude) can be found by combining the two component partial derivatives:
 . . . . . . . . . . . (4.3)
The partial derivatives for x and y are given as
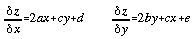 . . . . . . . . . . . (4.4)
Since we are only interested in the slope at the central point of the quadratic surface, by adopting a local coordinate system with the origin located at the point of interest, we can combine (3) and (4) where x = y = 0 giving,
 . . . . . . . . . . . (4.5)
This slope value is more usually represented in degrees, giving:
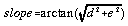 . . . . . . . . . . . (4.6)
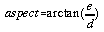
This definition is consistent with that reported in the literature (eg Evans 1979,1980; Zevenbergen and Thorne, 1987; Skidmore, 1989). Likewise, aspect is simply the polar angle described by the two orthogonal partial derivatives:
 . . . . . . . . . . . (4.7)
If we wish to create a single measure of the second order derivatives we must derive that measure for an intersecting plane so as to reduce the expression to an ordinary differential one. Thus we have several choices depending on the orientation of this intersecting plane. The plane itself can be defined uniquely by two vectors.
The form of curvature that is most appropriate will depend partly on the nature of the surface patch being modelled. Computational and interpretive simplicity may dictate a single measure for an entire DEM. Most commonly, this would be either mean curvature (eg Mitasova, 1994), profile or plan convexity (eg. Evans, 1979). For geomorphological analysis it would be useful to know curvature along, for example, channel cross-sections and longitudinal profiles. The derivations of some of these measures are discussed below.
(i) Profile and Plan Convexity
Profile and plan convexity are useful in that they separate curvature out into two orthogonal components where the effects of gravitational process are either maximised (profile convexity) or minimised (plan convexity). Evans (1979) defines profile and plan convexity measures (of dimension [L-1]) as follows,
 . . . . . . . . . . . (4.8)
 . . . . . . . . . . . (4.9)
Because these two measures involve the calculation of the slope vector, they remain undefined for quadratic patches with zero gradient (ie. the planar components d and e are both zero). In such cases, alternative measures need to be substituted. In all such cases, there is no component to plan convexity, any curvature being entirely orthogonal to the xy plane. Evans (1979) suggests two measures of minimum and maximum profile convexity,
 . . . . . . . . . . . (4.10)
 . . . . . . . . . . . (4.11)
For the elliptic case, both values will have the same sign; for the parabolic case, one of the values will be zero; and for the hyperbolic case, the two curvatures will be in opposite directions.
(ii) Longitudinal and Cross-sectional convexity.
To calculate the mean convexity in the direction of slope, we can reduce the problem to an ordinary differential one by finding the intersection between the quadratic surface and the plane in which the slope normal and aspect direction both lie,
Let s be a vector whose magnitude is proportional to the slope at the centre of the quadratic (x=y=0) and s' be orthogonal to this in the same plane as two axes X and Y (see Figure 5.3). Let alpha be proportional to the aspect direction. We can consider the distance along the X and Y axes (which correspond to the axes of the DEM, but with a local origin centred around a DEM cell) in terms of s and alpha,
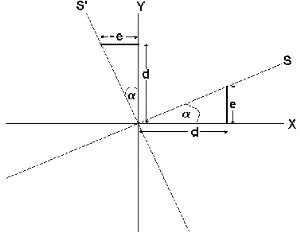 Figure 4.3 - Slope and aspect vectors
 . . . . . . . . . . . (4.12)
 . . . . . . . . . . . (4.13)
By combining (12) and (13) and substituting into (1), we get,
 . . . . . . . . . . . (4.14)
Which simplifies to,
 . . . . . . . . . . . (4.15)
The curvature of this univariate quadratic can be found by ordinary differentiation,
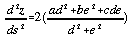 . . . . . . . . . . . (4.16)
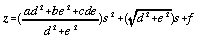
By convention, surface concavity is given a negative sign. This down-slope curvature value will be referred to as longitudinal curvature, longc. Curvature in the orthogonal direction (cross sectional curvature crosc) is found through similar triangles so that d becomes -e and e becomes d (see Figure 4.3). Thus the two measures are,
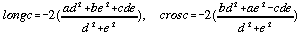 . . . . . . . . . . . (4.17)
Any order of polynomial could be used to model local surface patches, but a quadratic function can be regarded as a successful compromise between the number of data points required to uniquely model the surface and the fidelity with which the model fits the true surface. Planar facets would only require three points to define the polynomial so could therefore be modelled using a two by two local window. However, a planar model is not sufficient to identify surface specific points, or morphometric features (see Chapter 5).
Polynomials of order 3 or higher can model more convoluted surfaces including breaks ofslope (points of inflection), but require 10 points to define the surface. Since this would require a local window of more than 3 by 3 cells, the degree of surface generalisation becomes much greater. Thus the quadratic function appears the most widely and appropriately used model for general geomorphometric approximation.
Although capable of modelling all six morphometric feature types, there are a number of limitations to the quadratic model, particularly in the way the 6 coefficients are derived. Evans (1979) uses least squares to identify the optimum set of quadratic coefficients. This minimises the difference between modelled and measured values for the local window as a whole, even though it is only the parameter values at the centre of the patch that are of direct interest. As a consequence, the modelled surface does not necessarily pass through the local origin. Zevenbergen and Thorne (1987) argue that if the model is unconstrained at the origin (central data point in the window), it does not represent the land surface accurately.
There are a number of techniques available that reduce the residual value at the local origin. The modelled surface can be constrained by forcing it through the origin before minimising squared residuals (see section 4.4.4 below). Alternatively, a higher order of polynomial can be used so that there is no redundancy in data points. Zevenbergen and Thorne (1987) suggested a partial quartic expression which requires 9 coefficients. The unique solution derived from the 9 data points in a local window ensures fidelity at the origin and centre of each measured grid cell. A set of solutions adopted by other authors(eg Tobler, 1969; Struve, 1977 [both reported in Evans, 1979]) is to give measured cells in the local window different weights, perhaps excluding some cells altogether.
It becomes apparent that the statistically optimum set of coefficients that is used to model a surface patch may not necessarily be the most appropriate when identifying surface parameters at the centre of the surface. More particularly, it is important to assess whether there is any consistent pattern of residuals with respect to specific geomorphometric arrangements. That is, if residuals are not truly random, they are not true residuals in the statistical sense and we may consider reevaluating the form of our surface model. It was this process that was used to describe and model DEM uncertainty in section 3.3. Chapter 6 includes examination anddiscussion of the residuals produced by quadratic approximation using a variety of calibrated and 'real' surfaces.
The techniques reviewed for morphometric characterisation of DEMs are all constrained by the resolution of the model. The information derived using these techniques is relevant only to the scale implied by the resolution of the DEM. Since this scale is often arbitrarily defined and not necessarily related to the scale of characterisation required, derived results may not always be appropriate. Indeed, most of the acknowledged problems of morphometric characterisation result from either variation at a finer scale than the DEM ('noisy data') or variations on a coarser scale ('flat regions'). What is required are characterisation techniques that are somewhat independent of the resolution of the database used to store topographic information.
From a geomorphological perspective, it would seem ludicrous to only consider surface variation at a fixed scale when an assessment of an entire landscape is desired. Our own judgements both scientifically and 'intuitively' rely on an appreciation of landscape at a variety of scales simultaneously. Variation that occurs with scale is in itself a useful landscape diagnostic. It is for these reasons, that the remains of this chapter will consider how scale can be incorporated into the automatic characterisation of DEMs.
Given the utility of quadratic parameterisation of a surface, and the requirement that we must consider this parameterisation at a variety of scales, a number of possible solutions present themselves.
(i) Nearest neighbour sampling.
Tesseral based GIS have an implicit scale of processing that can be set either by theresolution of the data, or by the resolution of a 'view' of those data. The processing resolution of GRASS can be set independently of the data resolution, for example. This provides a mechanism for a multi-scale approach whereby parameterisation is carried out at a number of viewing resolutions, each of which corresponds to a different scale of processing.
The process of resampling at a coarser resolution in GRASS is carried out by 'nearest neighbour' sampling (Shapiro et al, 1993). That is, the value of each raster cell at the new resolution is equal to the value of the original cell that is nearest to its centre. As can be seen from Figure 4.4, this can result in spurious surface models, especially when spatial autocorrelation is relatively low. Additionally, the variance of the resampled elevations tends to be reduced as outlying values of a normal distribution are less likely to be resampled than those nearer the centre of the distribution.
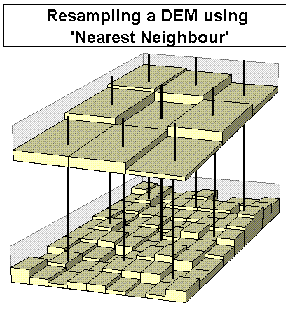 Figure 4.4 - Effect of resampling at coarser resolution using nearest neighbour techniques.
(ii) Maximum likelihood sampling
An alternative and more suitable model is adopted here that uses the least squares criterion to change scale. A local quadratic trend surface may be fitted through the original data values from which terrain parameters may be estimated. If we assume residuals from such a model are normally distributed, this process of resampling, is in effect, a maximum likelihood estimation (Unwin, 1975).
It should be recognised that this technique is a generalisation of Evans' 3 by 3 quadratic parameterisation to an n by n parameterisation. Details of the process are given in the next section.
Consider the derivation of the 6 coefficients that define a quadratic trend surface:
. . . . . . . . . . . (4.18)
This is more conventionally expressed as a specific case of a more general polynomial expression:
 . . . . . . . . . . . (4.19)
(eg. Unwin, 1975; Unwin and Wrigley, 1987; Press et al, 1988)
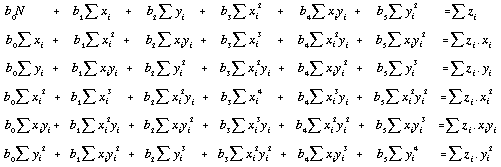
To solve this expression i (the number of points sampled) must be at least 6. If we limit the sample of elevation values to a square window centred around the point of interest, i will be 9, 16, 25, ... n2 as the local window increases from the smallest size (3 by 3) to the largest size (n by n) determined by the smaller side of the DEM. Where i = 9, the resultant quadratic expression will be identical to Evans' quadratic derivation (Evans, 1979).
Evans states that for the 3 by 3 case, "...the procedure [for fitting by least squares] is greatly simplified by the arrangement of data on the square grid. The six parameters are calculated by multiplying the 9 x 1 vector of altitudes by a 6 x 9 matrix of coefficients: matrix inversionis unnecessary." (Evans, 1979, p.28). He then goes on to give expressions for the 6 coefficients given in (18) as functions of the 9 cells in a 3x3 local window arranged as follows with a planimetric separation of g:
| z1 | z2 | z3 |
| z4 | z5 | z6 |
| z7 | z8 | z9 |
Whilst this simplification of the least squares solution can be applied to the 3 by 3 case, a matrix solution is required for the more general case of an n by n local window.
To solve the general case, the unknown coefficients are expressed as a set of 6 simultaneous equations, or normal equations (Unwin, 1975) :
 . . . . . (4.20)
The normal equations can be simplified due to the regular nature of the DEM sampling (as Evans, 1979, above). If all observed values zi are taken from a local window with dimensions n by n, where n is an odd number, a local coordinate system can be defined with the origin at the central cell and a grid spacing of g. Thus for a 5 by 5 window, the coordinates of each cell become:
(-2g,-2g) | (-2g,-g) | (-2g, 0) | (-2g, g) | (-2g, 2g) |
(-g,-2g) | (-g,-g) | (-g, 0) | (-g, g) | (-g, 2g) |
( 0,-2g) | ( 0,-g) | ( 0, 0) | ( 0, g) | ( 0, 2g) |
( g,-2g) | ( g,-g) | ( g, 0) | ( g, g) | ( g, 2g) |
( 2g,-2g) | ( 2g,-g) | ( 2g, 0) | ( 2g, g) | ( 2g, 2g) |
The symmetry of the coordinate system reduces all expressions without even exponents throughout to zero (as observed for the linear case by Unwin and Wrigley, 1987, p.352). In addition, the sum of x2 is equivalent to the sum of y2 and the sum of x4 is equivalent to the sum of y4. This matrix expression may also be reordered using Evans' notation ((18) above). The reordering of the normal equations so that the coefficients of the constant f (or b0 in (19) above) lie in the last row and column make computation of the matrix inversion much simpler (see 4.4.4 below). By expressing the reordered and simplified normal equations in matrix form we are left with the expression:
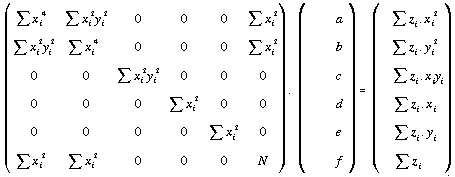 . . . . . (4.21)
The four constants of the matrix of sums of squares of cross products need only be found once for any given window size. The can be found efficiently for any window size of n2 cells involving approximately 2n calculations:
Name: FindNormal() |
Algorithm 4.1
Once the elements have been found, the matrix can be inverted (again, only once for a given window size). This is achieved using LU decomposition and LU back substitution (Press et al, 1992). For flexibility and clarity, matrices are stored as double indirection pointers with unit offset, vectors as single indirection unit offset pointers (see r.param.scale in the Appendix).
If we wish to constrain our quadratic regression we can force the trend surface through the central cell of our local DEM window. The regression surface becomes an exact interpolator (at the centre of the function) to use the nomenclature of Lam (1983). This can be achieved by creating a local origin through the central cell in both X-Y and Z directions. Thus all other elevations in the local window are expressed as relative vertical changes from the central value. Once this coordinate system has been adopted, the trend surface is forced through the origin by dropping the quadratic coefficient f (or b0) and all relevant elements of the normal equations (the bottom row and right-hand column of the matrix of cross products). Hence, (21) becomes:
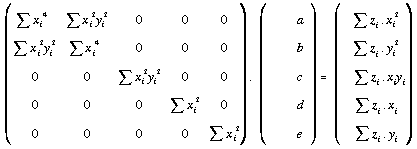 . . . . . (4.22)
Note that computationally, the solution of this matrix expression can be achieved through the LU decomposition and back substitution routines described in Section 4.4.3 using the full 6 by 6 matrix, but specifying the dimension of 5 in both routines.
Where there is good reason for requiring quadratic approximation though known values, this solution appears more elegant than the partial quartic expression resorted to by Zevenbergen and Thorne (1987). Firstly, there is no good geomorphological reason for resorting to polynomial expressions higher than order 2 (eg. Evans, 1979, Skidmore, 1989). Secondly, the effects of this constraint can be assessed directly by comparing parameters with those derived from the equivalent unconstrained quadratic models.
Unwin and Wrigley (1987) draw attention to the significance of points around the margins of a trend surface in determining the overall best fit. By quantifying leverage the effect of each control point on the resultant quadratic surface can be assessed (Unwin and Wrigley, 1987 p.353). In the context of modelling terrain, this effect would appear most significant for surfaces with low spatial autocorrelation. Here, isolated surface features exert greatest leverage when coincident with the outer corners of the
kernel. This can manifest as regular gridlike features on the modelled surface (see Chapter 6).
To counter this problem, a weighting matrix can be incorporated into the determination of modelled quadratic surface. Different cells can be given differing importance when constructing the quadratic function through them, usually some reflection of the positive autocorrelation of most surfaces. This might typically be of an inverse gradient or inverse distance squared form sometimes used in mean filtering in image processing (eg Niblack, 1986, p.79).
In common with all inverse distance functions, an (arbitrary) decision has to be made about the weight of the central cell, which by strict definition would have an undefined weight of 1/0. To avoid the problem of infinite weights, unity is added to each distance in the following weighting function:
 . . . . . . . . . . . . (4.23)
So, for example, the weights for a 5 by 5 kernel with an exponent of 1 would become:
1/3.83 | 1/3.24 | 1/3 | 1/3.24 | 1/3.83 |
1/3.24 | 1/2.41 | 1/2 | 1/2.41 | 1/3.24 |
1/3 | 1/2 | 1/1 | 1/2 | 1/3 |
1/3.24 | 1/2.41 | 1/2 | 1/2.41 | 1/3.24 |
1/3.83 | 1/3.24 | 1/3 | 1/3.24 | 1/3.83 |
For the most general case, where any weighting matrix may be used, we no longer have the property of symmetry when calculating the elements of the matrix of cross products (as in (21) above). Thus the general weighted normal equations matrix becomes,
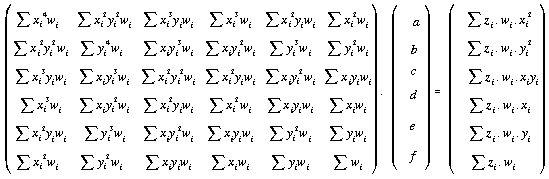 . . . (4.24)
This again may be solved using LU decomposition, for both the constrained and unconstrained cases.
Modelling of surface patches with quadratic functions allow the derivative properties of neighbourhoods to be characterised. In particular, the preceding section provides a mechanism for making scale-based relationships explicit. There are however further sets of surface properties that may be characterised that can incorporate a greater degree of spatialinformation. The notions of spatial autocorrelation and spatial texture are appropriate to DEM characterisation despite their more usual applications in geostatistics and image processing respectively. Spatial autocorrelation is a property that represents the degree of clustering of like values, while texture characterises the form of clustering. This section shows how both groups of measures can be extended spatially by taking measurements over a range of scales over a DEM.
The degree to which close neighbours over a surface share similar properties is characterised by spatial autocorrelation. Commonly, a single measure of spatial autocorrelation may be found for an entire surface that distinguishes generally smooth surfaces (highly positively autocorrelated), from rougher ones (lower spatial autocorrelation).
Let Z be a surface that is measured at locations i and at separations j, the spatial autocorrelation may be measured using the so-called Moran's I statistic:
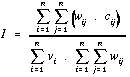 . . . . . . . . . . . . (4.25)
 . . . . . . . . . . . . (4.26)
This is the form most commonly reported in the literature (eg Cliff and Ord, 1981; Goodchild, 1986; Bailey and Gatrell, 1995). Values of I usually range between ñ1, where +1 indicates strong positive autocorrelation, -1 a strong negative autocorrelation and 0 a random uncorrelated distribution. The exact limits depend on the sample size and weightings used (see Goodchild, 1986, p.16 and Bailey and Gatrell, 1995 p.270)
Measurements of I over a raster can be simplified if we only measure a single value at j for each location i and give each measurement a unit weighting. Additionally, by simplifying (26), we get:
 . . . . . . . . . . . . (4.27)
While this measure is relatively simple to calculate in a raster GIS environment, it tells us very little since the measure is highly dependent on the separation or lag between i and j (eg. Goodchild, 1986). What is more useful is to calculate the measure at a variety of lags in order to measure how clustering changes with scale. It is this technique that forms the basis of much geostatistical interpolation (eg Jounel, 1978; Isaaks and Srivastava, 1989).
Consider the measurement of I over a raster surface with a lag of 1 grid cell unit to the right. All the locations i that can be measured are shown in Figure 4.5a. This includes the entire raster with the exception of the right-most column of grid cells. Likewise the lagged cells j consist of the entire raster bar the left-most column (Figure 4.5b). The intersection of these two sets (Figure 4.5c) comprises nearly the whole raster, thus,
 . . . . . . . . . . . . (4.28)
By definition, the mean and variance of all i, j and the whole raster will be equal if themodelled surface possesses stationarity and homoscedasticity. Thus for small lags or surfaces with a non varying mean and variance the expressions (25) to (27) may be used appropriately.
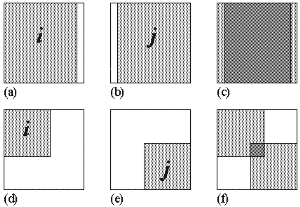 Figure 4.5 - Spatial extent of measured and lagged cells in spatial autocorrelation and variogram calculation.Consider a larger lag of approximately half the length of one side of the raster in a south westerly direction. The measurable locations i occupy a smaller proportion of the entire raster (Figure 5.5d). Likewise the lagged locations j occupy an equally small, but different set of locations (Figure 5.5e). For a non-stationary heteroscedastic surface, the variance of i will not adequately reflect the variance of all measured cells (i È j), and as such expressions (25) to (27) are not valid measurements. It should be noted that such 'edge effects' will also be present for irregular subdivisions of space. Any lagged measure of spatial autocorrelation using this method should be treated with caution for non-stationary, heteroscedastic data.
An initially attractive alternative would appear to be to consider the strong association between spatial autocorrelation and spatial correlation (Wartenberg, 1985). A measure could then be made of the association between i and j by calculating Pearson's Product Moment Correlation Coefficient:
 . . . . . . . . . . . . (4.29)
However, if the variance of i or the variance of j is 0, the correlation coefficient is undefined.
The alternative suggested here is that both i and j must be included in the measurement of variance. In the case illustrated by Figure 4.5c this could be found by calculating the variance of the entire raster. However, for larger diagonal lags (eg. Figure 4.5f), there are substantial portions of the raster that are not measured at all as part of covariance calculation. It is significant to note that these unmeasured portions of the raster are not just a function of lag magnitude, but of lag direction. Diagonal profiles to not 'pack' well into a square lattice arrangement (the implications of which are demonstrated in below).
Moran's I for any lag on a raster can therefore be represented as,
 . . . . . . . . . . . . (4.30)
This can be calculated for any lag within a raster with relative computational efficiency (see Algorithm 4.2)
Name: MoranLag() |
To consider possible edge effects in more detail, it is perhaps clearer to compare the modified calculation of Moran's I described above with the more common geostatistical description of scale dependent autocorrelation, the semivariogram. The semivariogram function ë(h) can be defined as,
 . . . . . . . . . . . . (4.31)
This measure is in effect the non standardised version of Geary's index of spatial autocorrelation (Goodchild, 1986). Note that, unlike the original definition of Moran's I given in (27), but in common with the modified definition (29), values of i and j can be interchanged giving identical results (see also Isaaks and Srivastava, 1989, p.60).
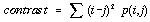
Figure 4.6 shows three surfaces (left column) from which both a 2 dimensional variogram Moran' I surface have been calculated. Instead of the more usual 1 dimensional profile, ë(h) and I have been calculated separately for lags in different directions (a series of narrowly defined directional variograms). The results of each calculation are mapped back onto the raster metric, where the lag magnitude and direction are indicated by the location relative to the centre of the raster. The value of the statistic for each lag is colour coded on a linear scale, ë(h)min, being white, ë(h)max, black, and I having the standard blue-red bipolar colour scheme described in 3.2.2. This is thought to provide a very powerful visual diagnostic of scale dependency and anisotropy of a surface.
Edge effects can most clearly be seen with the variogram surfaces. Consider the centred circle of radius r (Figure 4.6 top left). Its variogram at lags of _ r is as expected, a gradual increase in variance with lag. As the lag further increases so the lines of equal variance become distorted towards a diamond shape. At the largest lags, maximum variance is confined to the four corners of the surface. This surface can be explained by the packing properties of diagonal lags in comparison with perpendicular lags. For larger diagonal lags, substantial parts of the surface are not measured at all (see Figure 4.5f). It is these unmeasured corners that inthe case of the centred circle contain flat regions that would, if measured, reduce overall variance. For perpendicular lags, even large ones, there is no part of the raster that remains unmeasured. A circle that is located in one corner gives an even more strongly anisotropic variogram (Figure 4.6 middle) for the same reasons. An uncorrelated Gaussian random surface is shown in Figure 4.6 (bottom row) along with its variogram. It would be expected that the variogram should have no structure since there is no spatial structure in the original. However, some structure appears evident (disregarding the obvious symmetry of all 2D variograms) as alternating patches of lighter and darker texture. This is due entirely to a systematic change in the sampled cells for larger lags.
The implications for interpreting both 2D and conventional variograms are important to consider here. Edge effects are most apparent here because large lags are included and highly heteroscedastic surfaces are tested. However, even an uncorrelated, stationary homoscedastic surface can give rise to artificial structure. They demonstrate that great care must be exercised in checking the representativeness of samples for variance calculation. This is particularly (but not exclusively) the case for raster based sampling.
The problem can be vastly reduced (but not eliminated) by measuring a standardised autocorrelation measure. The right column of Figure 4.6 shows the Moran's I surface for the same three test surfaces. Because each measure of covariance is standardised by the variance of all cells used in calculation, the effects of systematic spatial bias are reduced. It is only in these extreme heteroscedastic surfaces that any artifacts are produced.
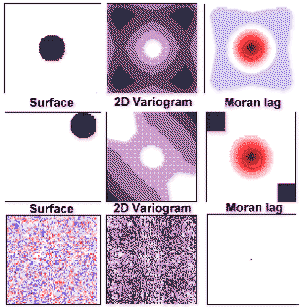 Figure 4.6 - Some geometric surfaces and their 2-dimensional variograms and 'lag' diagrams.
The problems of variogram interpretation introduced by edge effects are partly due to the application of the analysis in a raster-based framework. The development of both regionalised variable theory and measures of spatial autocorrelation arises from the characterisation of irregularly distributed data. Both these techniques have only later been adapted for a raster framework (eg, Cliff and Ord, 1981 and Cressie, 1993). An alternative set of techniques has arisen from the image processing domain, designed specifically for raster based surface data.
Co-occurrence matrices, or grey-tone spatial dependence matrices (Haralick et al, 1973) provide quantitative descriptions of the spatial and attribute relationships between cells within a gridded framework. Haralick et al (1973) point out that they offer a more refined description of spatial relationship than single spatial autocorrelation measures since they can be used for detecting specific textural features such as rippling, lineation and molling. While beingprimarily developed as texture descriptors of grey-tone images, they may be equally well applied to raster DEMs.
Consider a raster surface, that is quantised into k classes. The co-occurrence matrix M consists of k by k cells where M(x,y) consists of the probability of a cell on the original raster having a class Mx and a lagged (h) cell on the same raster having a class My. Lags have traditionally been set to first order adjacency in one of 4 possible profile directions, but in theory could be set to any value. Clearly the form of the co-occurrence matrix M will depend on the number of classes k and the lag h used, however there are a number of generalised properties of such matrices. For lagged profiles that extend on either side of measured cells, the resultant matrix will be approximately symmetrical along the leading diagonal. Deviations from symmetry will occur due to the edge effects discussed in section 4.5.1 above. Highly positively autocorrelated surfaces will have the majority of entries concentrated along the leading diagonal of the matrix (that is the class k of any cells similar or identical to the class of its near neighbour). If the 2-dimensional matrix is projected onto a 1-dimensional line down the leading diagonal, the result is equivalent to the probability adjusted frequency histogram. An uncorrelated surface comprising of independent random uniform deviates would result in a co-occurrence matrix of equi-probable cells.
The co-occurrence matrix can be easily calculated for any DEM using the algorithm presented in Algorithm 4.3. Note that for computational efficiency, the matrix is stored as the (integer) sum of co-occurrences rather than their (floating point) probabilities. This can be easily converted by dividing each cell by the total number of measured raster cells n.
Name: Co_occur() |
Algorithm 4.3
By convention, the co-occurrence matrix is used for calculating a number of textural measures. Haralick et al (1973) suggested 14 such features, but found it "hard to identify which specific textural characteristic is represented by each of these features" (Haralick et al, 1973, p.613). Weszka et al (1976) suggested a sub-set of these measures that corresponded to identifiable textural characteristics. It is a similar sub-set that is considered here, although even in selecting just 5 measures, it is clear that there is some degree of dimensional overlap in what they measure.
The six textural measurements considered here can be defined as follows,
 . . . . . . . . . . . . (4.32)
  . . . . . . . . . . . . (4.33)
 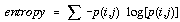 . . . . . . . . . . . . (4.34)
  . . . . . . . . . . . . (4.35)
 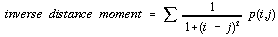 . . . . . . . . . . . . (4.36)
Two new developments that arise from such textural description are considered here. Firstly, it becomes apparent that the 14 texture measures originally suggested by Haralick et al (1973), in many cases, quantify information that can be found by visualising the co-occurrence matrix itself. In a scientific visualisation context, the graphical representation of the matrix may well provide important diagnostic information. A routine was written therefore, to represent the co-occurrence matrix of any surface as a grey tone raster (see Appendix). Two matrix visualisations are shown in figure 4.7. Figure 4.7a shows the matrix for a fractal surface with fractal dimension 2.10, Figure 4.7b shows the matrix for a surface with dimension 2.90. The reduced spatial autocorrelation of the latter is clearly visible as less concentration of values around the leading diagonal. Note that both images represent empty matrix cells (by far the most common) as mid-grey. This is to distinguish them from cells with a few entries (ie a non-zero, but low probability of co-occurrence).
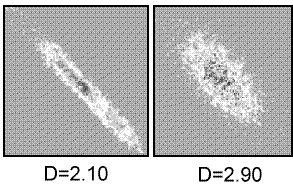 Figure 4.7 - Co-occurrence matrices visualised for 2 fractal surfaces of dimension 2.1 and 2.9.
The final development of the co-occurrence approach is similar to that used for measures of spatial autocorrelation. As with this measure, textural measures are highly dependent on the scale at which texture is measured. The discussion on the relative importance of tone and texture by Haralick et al (1973), is really just one of scale. What appears as texture at one scale, will appear as tone at another. Equally, the notion of pattern as an image characteristic address the same type of spatial arrangement at yet another scale. It therefore seems obvious to examine the relationship between texture measurements and scale. This is achieved here by constructing a similar lag map to the one described in section 4.5.1, but this time at each lag, one of the five texture measures described above is measured. Thus five maps of the explicit relationship between scale and textural components are created. An example of such a set is shown in Figure 4.8 where a fractal surface of dimension 2.10 is measured.
On of the problems in the interpretation of images such as those described in this section is that without experience, we have no basis with which to make comparisons. Chapter 6 therefore includes a 'calibration' of all tools and visualisations discussed in this chapter, along with an assessment of their utility.
 Figure 4.8 - 'Lag maps' of 5 co-occurrence matrix texture measures. (a) contrast; (b) inverse distance moment; (c) angular second moment; (d) asymmetry; (e) entropy.
Jo Wood, March, 1996
