Visualizing Precisions
| Estimated local error images are used to visualize computation
error maps, which represent scalar field quantities defined as the
distribution of energy error norm estimates for a given computation. Estimated local error Image objects belong to Static Case Solution objects sets. The program evaluates the validity of the computation and provides a global statement about this validity. It also displays a predicted energy error norm map which gives qualitative insight about the error distribution on the part.
|
|||||||||||||||||
| This task shows how to generate Estimated local
error images on parts.
|
|||||||||||||||||
You can use the sample25.CATAnalysis documen. Before You Begin:
|
|||||||||||||||||
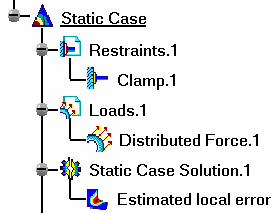
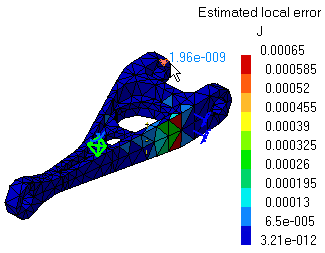
| 1. Click the Precision icon The Estimated local error image is displayed and an Estimated local error Image object appears in the specification tree under the active Static Case Solution objects set.
You can visualize the Estimated Error image in different ways by modifying the Custom view modes. To do this, you open the View menu and select Render Style -> Customize View option. The Estimated local error distribution on the part is visualized in fringe pattern mode, along with a color palette.
This map provides qualitative information about the way in which estimated computation errors are relatively distributed on the part.
2. When the mouse cursor is passing over a finite element, its Error Estimate (relative strain energy variation) is displayed.
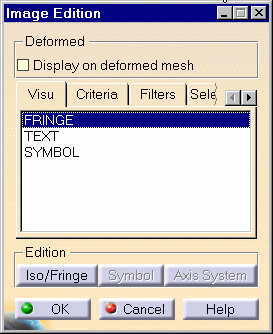
4. Double-click the Estimated local error object in the
specification tree to edit the image.
The following tabs are available:
In addition, the following Image Edition buttons are available: 5. Click OK to quit the dialog box. You can use the right mouse click (key 3) on a Estimated local error feature in the specification tree and select the option called Activate / Deactivate to turn the corresponding image on or off.
|
|||||||||||||||||
| Products Available in Analysis Workbench
The ELFINI Structural Analysis product offers the following additional features with a right mouse click (key 3) on a Estimated local error feature in the specification tree: Report: this icon generates a report in .html and .txt formats.
|
|||||||||||||||||
|
|
|||||||||||||||||


